Birth Chart Data · Updated
What Time Are Most Babies Born? 3.6 Million US Birth Times, and the Birth Charts They Make
Almost every US birth record carries the time of birth, to the minute. We counted all 3,619,990 records in the CDC's 2025 file, then cast the sky for every recorded minute with NASA JPL's DE440 ephemeris to see what those times do to a birth chart.
Quick answer
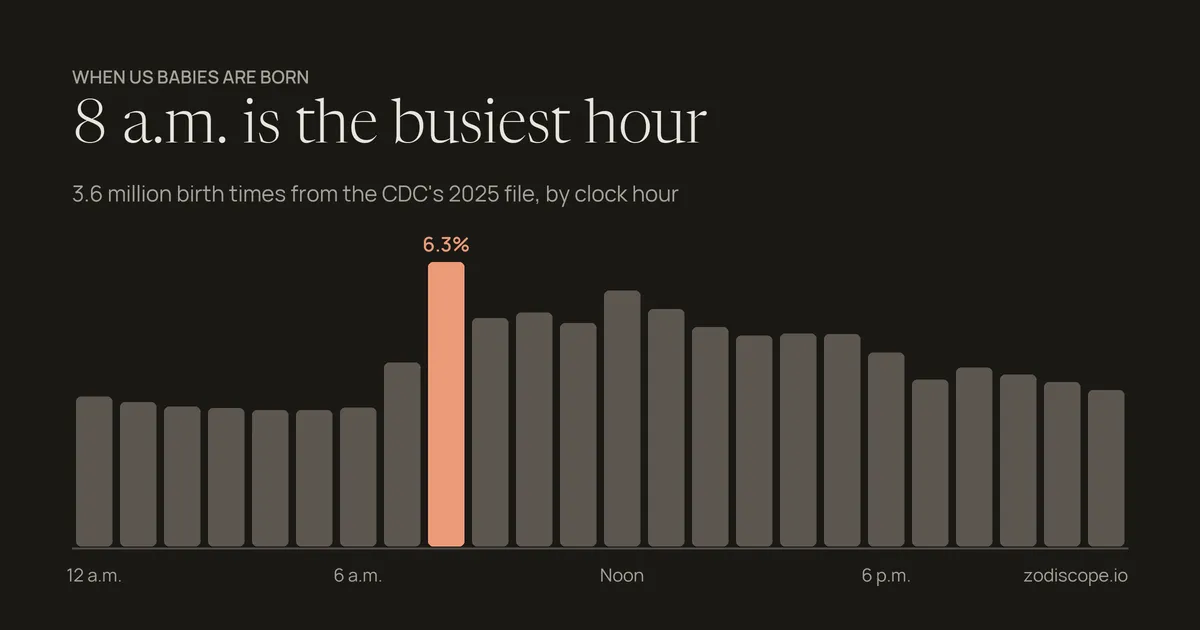
8 a.m. is the busiest hour for US births. In the CDC's 2025 records, 6.3% of babies were born between 8:00 and 8:59 a.m., followed by the noon hour (5.6%). The busiest minute was 8:05 a.m., and the quietest hour was 4 a.m., with 3.0%.
| US births in the 2025 file | 3,619,990, all but 514 with a time of birth |
| Busiest hour | 8 a.m., 6.3% of births |
| Quietest hour | 4 a.m., 3.0% |
| Busiest minute | 8:05 a.m., 4,775 births |
| Born 6 a.m. to 5:59 p.m. | 58.4% |
| 8 a.m. births that were cesareans | 58.7% |
| Weekend births a day | 31.7% fewer than on a weekday |
| Day charts, Sun above the horizon | 59.0% of births in our New York model |
Born in the 8 a.m. rush or at 4 in the morning? The minute you were born sets your rising sign and your Sun's house. The free birth chart calculator shows both from your birth date, place and time, with no account. In its default Placidus houses, a Sun in houses 7 to 12 means a day chart.
Cast a free birth chart for your birth minute →US births by hour: the 2025 table
An even spread would put 4.2% of births in each hour. The real day runs from 3.0% at 4 a.m. to 6.3% at 8 a.m., 2.1 times as many. The four hours from 8 a.m. to 11:59 a.m. held 21.4% of all births, where an even spread gives 16.7%.
| Hour of birth | Births | Share |
|---|---|---|
| 12 a.m. | 120,470 | 3.3% |
| 1 a.m. | 116,133 | 3.2% |
| 2 a.m. | 112,385 | 3.1% |
| 3 a.m. | 111,003 | 3.1% |
| 4 a.m. | 109,424 | 3.0% |
| 5 a.m. | 109,764 | 3.0% |
| 6 a.m. | 111,392 | 3.1% |
| 7 a.m. | 147,262 | 4.1% |
| 8 a.m. | 227,108 | 6.3% |
| 9 a.m. | 182,685 | 5.0% |
| 10 a.m. | 187,154 | 5.2% |
| 11 a.m. | 178,532 | 4.9% |
| Noon | 204,424 | 5.6% |
| 1 p.m. | 189,919 | 5.2% |
| 2 p.m. | 175,392 | 4.8% |
| 3 p.m. | 168,864 | 4.7% |
| 4 p.m. | 170,435 | 4.7% |
| 5 p.m. | 170,009 | 4.7% |
| 6 p.m. | 155,138 | 4.3% |
| 7 p.m. | 133,815 | 3.7% |
| 8 p.m. | 143,356 | 4.0% |
| 9 p.m. | 137,647 | 3.8% |
| 10 p.m. | 131,812 | 3.6% |
| 11 p.m. | 125,353 | 3.5% |
Each row is the 60 minutes from the hour shown, local clock time at the place of birth. Shares are of the 3,619,476 2025 records with a time. Source: CDC natality public-use file, 2025.
The shape has barely moved in twelve years. The National Center for Health Statistics charted 2013 births in 41 states and DC, 90% of US births, the same way and found the same 8 a.m. peak, at 6.3%, with noon second at 6.0% (NCHS Data Brief No. 200). In 2025, noon was still second but lower, at 5.6%, and the night hours were a little busier.
The most common birth time: 8:05 a.m.
Down to the minute, 8:05 a.m. was the most common birth time of 2025, with 4,775 babies. That's 1.9 times the 2,514 an even spread would give each minute. All ten of the busiest minutes fell between 8:00 and 8:10 in the morning.
The quietest minute was 7:03 a.m., with 1,695. Both 7 o'clock hours show a dip. 7 a.m. is the quietest hour for vaginal births, and 7 p.m. sits below the hours on either side of it in the table above.
Why so many babies are born at 8 a.m.
Cesarean births. 32.4% of 2025 births to US residents were cesareans, the rate the CDC reported for the year (NCHS Data Brief No. 571). 11.4% of all cesareans came in the 8 a.m. hour, more than in any other. In 2013 that share was 11.6%, and 14.3% for cesareans with no trial of labor. In 2025, 58.7% of the babies born in the 8 a.m. hour were cesareans.
Vaginal births are spread far more evenly. Their busiest hour was 5 p.m., with 4.9% of vaginal births, and 7 a.m. was their quietest. Labor was induced for 34.7% of the 2025 births with that box filled in, and in 2013 induced vaginal births peaked at 3 p.m.
Are more babies born at night?
No, not in the US. 58.4% of 2025 births came between 6 a.m. and 5:59 p.m., and 41.6% in the twelve hours from 6 p.m. to 5:59 a.m. Every hour from midnight to 6:59 a.m. held between 3.0% and 3.3% of births, the quietest stretch of the day.
England looks different for labor that starts on its own. A study of 5.09 million singleton births in NHS maternity units from 2005 to 2014 found that spontaneous births after spontaneous labor peaked around 4 a.m. (Martin and colleagues, PLOS ONE, 2018).
Fewer babies are born on weekends
Weekdays averaged 10,904 births a day in 2025 and weekends 7,443, 31.7% fewer. Tuesday was the busiest day, with 11,231 a day, and Sunday the quietest, with 6,916.
The 8 a.m. peak is a weekday thing. That hour held 6.7% of weekday births and 4.6% of weekend births.
A free ZodiScope account saves your birth chart and shows the transits touching it today.
Save your chart and see today's transits →Is the time on a birth certificate rounded?
The 2025 records show little bunching on round minutes. Hospitals record the time of birth to the minute, and the CDC file stores it on a 24-hour clock (2025 User Guide). If clerks rounded often, times ending in :00 and :30 would stand far above the rest. They barely do: 1.78% of times end in :00 and 1.75% in :30, against 1.67% for an even spread, and 20.6% end in a multiple of five, against 20.0%.
3,084 babies were born at 12:00 p.m., about the same as the 3,081 at 12:01. The one group that does look rounded is small: the 4,399 records with no delivery method, where 27.7% of times end in a multiple of five.
If a time ending in :00 was rounded from anywhere in the half hour either side, the rising sign could be different for 49.9% of those births in our New York model. That's why the rising sign needs an exact birth time more than any other placement. If yours reads :00 or :30 and you have reason to doubt it, cast the chart for 15 minutes either side and compare.
Day chart or night chart: most US babies have a day chart
Hellenistic astrologers sorted every chart into one of two kinds, called sect. If the Sun was above the horizon at birth, the chart is a day chart; if it was below, a night chart. Chris Brennan explains it on The Astrology Podcast, episode 274: in a day chart the Sun leads, and in a night chart the Moon does.
Over a whole year the Sun is above the horizon about half the time (50.2% of minutes in New York). US babies aren't born evenly over the clock, though. Cast for New York, 59.0% of 2025 births have a day chart, and the share stays between 58.8% and 59.7% in every city we ran from Honolulu to Seattle (57.8% in Anchorage).
70.7% of cesarean births in the New York model have a day chart, against 53.4% of vaginal births.
Where the Sun sits in a morning birth chart
After sunrise the Sun climbs through the eastern sky toward the top of the chart. In house terms that's the 12th, 11th and 10th houses, the arc between the Ascendant and the Midheaven. In the New York model every baby born in the 8 a.m. hour has the Sun there (100%). For many of them it's the 12th, and Sun in the 12th house covers what that placement means.
Across all 2025 births cast for New York, 30.2% have the Sun in houses 10 to 12, where an even clock would give 25.1%. For cesarean births it's 42.1%, and for vaginal births 24.6%.
These shares hold in Placidus, Koch, Porphyry, Regiomontanus and the other house systems built on the Ascendant and Midheaven, because those two points mark the same quarter in all of them. Only the cusps between the 10th, 11th and 12th houses differ. For what each house covers, see the twelve houses of the birth chart.
No birth time: how often the Moon sign is wrong
The Moon changes sign every two to three days, and it changed sign during the birth day for 44.1% of 2025 births in the New York model. A chart cast for noon, the usual stand-in for a missing time, then shows the wrong Moon sign for 9.8% to 9.9% of births in every city we ran.
That's a little better than the 10.9% to 11.0% you get counting every minute of the year, because real births bunch into the daytime, closer to noon. The Moon sign guide shows how to settle your Moon sign without a birth time.
Rising signs by US city: the latitude effect
Latitude changes how common each rising sign is. Signs rise at different speeds, and the gap grows the farther north you go. In Seattle, 45.6% of births have Leo, Virgo, Libra or Scorpio rising and only 8.3% have Aries or Pisces. In Miami it's 38.1% against 12.3%.
| City | Latitude | Day chart | Sun in houses 10 to 12 | Aries or Pisces rising | Leo to Scorpio rising |
|---|---|---|---|---|---|
| Honolulu | 21.3° N | 59.2% | 29.9% | 13.0% | 36.7% |
| Miami | 25.8° N | 59.5% | 31.2% | 12.3% | 38.1% |
| Houston | 29.8° N | 59.5% | 31.2% | 11.8% | 39.1% |
| Phoenix | 33.4° N | 59.1% | 29.7% | 11.2% | 40.0% |
| Atlanta | 33.7° N | 59.7% | 31.8% | 11.2% | 40.2% |
| Los Angeles | 34.1° N | 58.9% | 30.1% | 11.0% | 40.4% |
| Denver | 39.7° N | 59.1% | 30.4% | 10.1% | 42.3% |
| New York | 40.7° N | 59.0% | 30.2% | 9.9% | 42.7% |
| Chicago | 41.9° N | 58.9% | 30.0% | 9.6% | 43.1% |
| Boston | 42.4° N | 58.8% | 29.7% | 9.5% | 43.3% |
| Minneapolis | 45.0° N | 59.2% | 30.9% | 9.0% | 44.3% |
| Seattle | 47.6° N | 59.1% | 30.7% | 8.3% | 45.6% |
| Anchorage | 61.2° N | 57.8% | 30.6% | 3.5% | 55.5% |
Model figures: all 3,619,476 2025 US birth times with a stated time, cast as if born in each city in turn. "Leo to Scorpio" is Leo, Virgo, Libra and Scorpio together.
The birth timetable hardly touches rising signs: in every city, each sign's share of births sits within 0.3 points of its share of the minutes in the year. Anchorage, at 61.2° N, is the extreme case, with 3.5% Aries or Pisces rising.
US birth time data: sources, model and code
- Counts are real records. Every figure about hours, minutes, weekdays and delivery method comes from the 3,619,990 records in the CDC's 2025 natality public-use file, births in the 50 states and DC. The total of US-resident births matches NCHS Data Brief No. 571 exactly.
- Chart figures are a model. The public file has no state and no day of the month. So each month's births go evenly across the days of that month, at their recorded clock minute, and all births are cast in one city at a time, with that city's time zone and daylight saving time. A city figure means births timed like the US in 2025, cast in that city. It isn't a count of people born there.
- Sky positions come from NASA JPL's DE440 ephemeris (JPL planetary ephemerides) through the Skyfield library, tropical zodiac. The same code reproduces the birth-time figures on our birth chart calculator page to the tenth of a percent.
- Data and code are public. The hour and minute tables, the model code and its results are in our data folder. Reuse them freely with credit to ZodiScope.
A second, separate run with the PyEphem library checked the headline numbers before publication.
Your own birth minute
Enter your birth date, place and time to see your rising sign, the house your Sun landed in and every planet's degree.
Get your free birth chart →Keep reading
- · Once the chart is cast, how to read a birth chart walks through it in order.
- · The angles between planets matter as much as their houses: a guide to birth chart aspects.
- · The studies for and against astrology, side by side: is astrology real?
FAQ
What is the most common time for a baby to be born in the US?
8:05 a.m. was the single most common birth time in the CDC's 2025 records, with 4,775 babies, and the 8 a.m. hour was the busiest hour, with 6.3% of births. All ten of the busiest minutes of the day fell between 8:00 and 8:10 in the morning. Cesareans accounted for 58.7% of births in the 8 a.m. hour.
Do C-section babies have different birth charts?
On average, yes: their charts lean toward a daytime Sun. In our model of 2025 US birth times cast for New York, 70.7% of cesarean births have a day chart, with the Sun above the horizon, against 53.4% of vaginal births. 42.1% of cesarean births have the Sun in houses 10 to 12, against 24.6%. The chart itself is cast the usual way, for the time of birth on the record.
What time of day are the fewest babies born?
4 a.m. is the quietest hour, with 3.0% of 2025 US births, and every hour from midnight to 6:59 a.m. holds between 3.0% and 3.3%. The quietest single minute was 7:03 a.m., with 1,695 births. Sunday is the quietest day of the week, at 6,916 births a day.
Is a 12:00 birth time on a certificate real or rounded?
The 2025 records show no pile of rounded times at noon. In those records, 3,084 babies were born at 12:00 p.m., about the same as the 3,081 born at 12:01 and the 2,944 at 11:59. Across the whole day, only 1.78% of times end in :00, close to the 1.67% an even spread would give.